Infographic
 |
| Source: https://buchananpr.com/wp-content/uploads/what-is-an-infographic-cropped.jpg |
Another assignment I enjoyed completing was the creation of an infographic. In my previous life I was a markeitng communications manager so I often was creating brochures, writing press releases, and the likes. I believe infographics are a great tool for students to use to convey information.
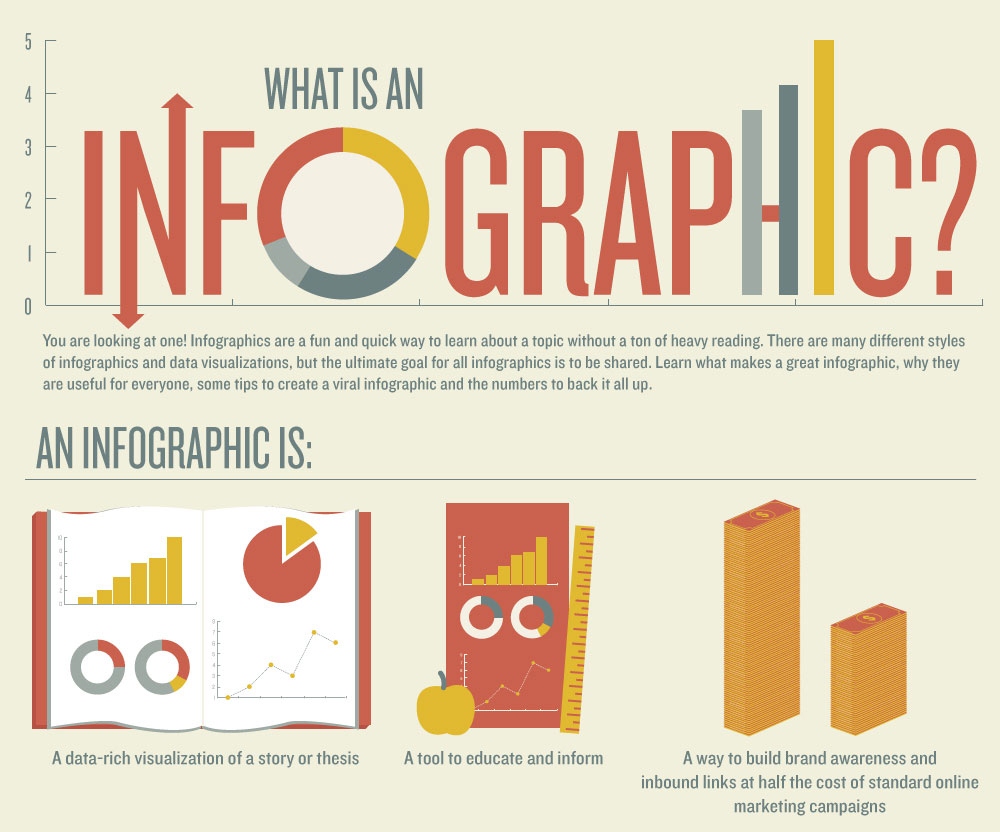
What is an infographic?
An infographic is a way to display information, data. Basically it displays key takeaways, a snapshot if you will of a topic.
Why use an infographic as an assessment tool?
- Building infographics is a real world skill that involves higher order thinking skills.
- Infographics will quickly show you if your students have mastered the content assigned.
- Infographics can be built around any subject, content area, or topic.
- You can apply three Common Core Literacy standards with one assignment
Source: https://educationtnt.wikispaces.com/file/view/InfographicsforClassroomUse.pdf
Here is the infographic I created comparing Quizlet and Kahoot. As you can see, it is an easy visual to look at and read about the two applications. It certainly is quicker to look at this than to go into both websites and research the information.
I believe infographics would be a great tool for students to use in the classroom for comparing and contrasting things, providing data on a topic, summary of a book, to name a few. It allows students creative freedom to express their ideas and information where some may find difficult writing or speaking.


Your infographic is a wonderful visual comparison of Kahoot and Quizlet.
ReplyDelete